
The traditional methodology to calculate the efficiency of decision making units is to estimate a frontier either using non-parametric techniques (e.g., DEA) or parametric techniques (e.g., stochastic frontier models). In order to do this the output and inputs need to be established. If the purpose is to calculate the efficiency of teams/managers in a sport league there is a consensus to use the number of points or winnings as output and quality measures of the squad as inputs. Once it is estimated the frontier to calculate the efficiency index is straightforward by diving observed output by the frontier output given the inputs.
I have recently proposed (http://footballperspectives.org/ranking-football-managers-big-5-leagues-2011-12-season) an alternative way to calculate the efficiency of managers by using odds. The idea is quite simple, first it has to be computed the probability for the teams of getting a certain amount of points at the end of the league given the odds[1], that means that it is calculated the density function of the points at the end of the league. Thereafter, it can be computed the probability of the cumulative distribution function at the actual number of points. In other words, it is computed the probability that a certain team would have done less points. This figure can be interpreted as an efficiency index given that it is bounded between zero and one and that the greater the value the greater the efficiency.
Next, I am going to compare the efficiencies that arises from estimating a production frontier for the coaches in the Liga BBVA at the season 2011-2012 (http://footballperspectives.org/efficiency-managers-spanish-football-league-2011-12-season) and the efficiency of the teams derived from the odds. To estimate the production function it was used as output the ratio between points obtained and the total possible points (i.e., 3 x the number of matches) and as input the value of the most valuable goalkeeper, 6 defenders, 6 defenders, and 3 forwards from http://www.transfermarkt.co.uk.
Table 1 shows such comparison.
|
Team
|
Squad €
|
Points
|
TE frontier
|
Rank frontier
|
TE odds
|
Rank odds
|
Rank diff.
|
|
Levante U.D.
|
2.6E+07
|
55
|
100.0%
|
1
|
93.0%
|
2
|
1
|
|
Real Madrid C.F.
|
4.6E+08
|
100
|
100.0%
|
2
|
96.2%
|
1
|
-1
|
|
C.A. Osasuna
|
3.0E+07
|
54
|
95.0%
|
3
|
87.9%
|
3
|
0
|
|
F.C. Barcelona
|
5.5E+08
|
91
|
88.0%
|
4
|
38.2%
|
14
|
10
|
|
R.C.D. Mallorca
|
4.4E+07
|
51
|
83.0%
|
5
|
85.7%
|
4
|
-1
|
|
Real Betis Balonpié
|
3.4E+07
|
47
|
81.0%
|
6
|
48.4%
|
11
|
5
|
|
Rayo Vallecano
|
2.2E+07
|
43
|
81.0%
|
7
|
47.4%
|
12
|
5
|
|
Valencia C.F.
|
1.3E+08
|
61
|
80.0%
|
8
|
49.0%
|
10
|
2
|
|
Málaga C.F.
|
1.0E+08
|
58
|
79.0%
|
9
|
56.3%
|
9
|
0
|
|
Getafe C.F.
|
5.2E+07
|
47
|
74.0%
|
10
|
59.8%
|
8
|
-2
|
|
R.C.D. Espanyol
|
4.7E+07
|
46
|
74.0%
|
11
|
45.5%
|
13
|
2
|
|
Real Sociedad
|
6.0E+07
|
47
|
72.0%
|
12
|
72.3%
|
5
|
-7
|
|
Atlético de Madrid
|
1.5E+08
|
56
|
70.9%
|
13
|
30.8%
|
16
|
3
|
|
Real Zaragoza
|
4.4E+07
|
43
|
70.3%
|
14
|
63.4%
|
7
|
-7
|
|
Granada C.F.
|
4.3E+07
|
42
|
68.5%
|
15
|
66.8%
|
6
|
-9
|
|
Athletic de Bilbao
|
1.1E+08
|
49
|
67.0%
|
16
|
26.9%
|
17
|
1
|
|
Sevilla F.C.
|
1.2E+08
|
50
|
66.0%
|
17
|
19.4%
|
18
|
1
|
|
Sporting de Gijón
|
3.9E+07
|
36
|
59.9%
|
18
|
37.0%
|
15
|
-3
|
|
Villarreal C.F.
|
1.5E+08
|
41
|
51.9%
|
19
|
11.6%
|
19
|
0
|
|
Racing de Santander
|
2.8E+07
|
27
|
48.4%
|
20
|
6.8%
|
20
|
0
|
|
Mean
|
75.5%
|
52.1%
|
|||||
|
SD
|
0.14
|
0.26
|
|||||
|
Corr TE frontier-squad
|
0.34
|
||||||
|
Corr TE odds-squad
|
0.02
|
There is one team that is really benefited from obtained the efficiency using the production instead by using the odds methodology, FC Barcelona. Why? To answer this question is worthy to analyze the following picture that helps to explain how it works the production function methodology.
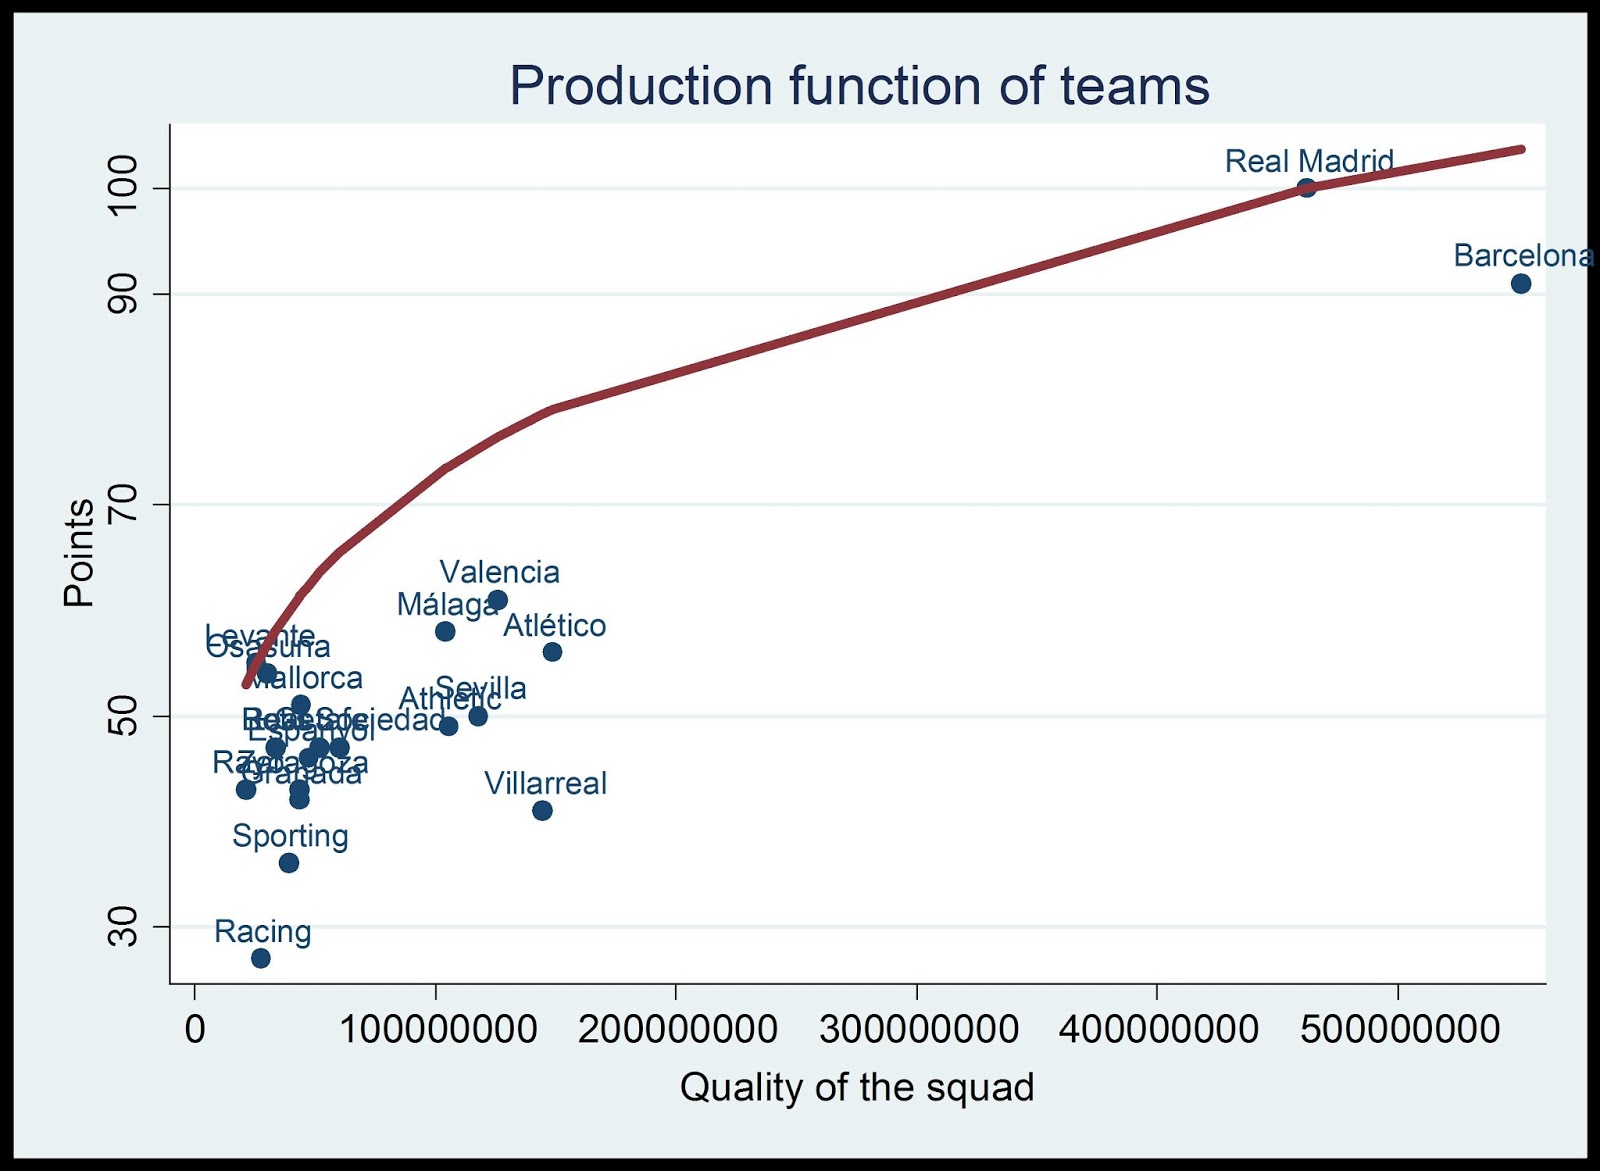
Note: The red line indicates the estimated production function
FC Barcelona with a bit better squad than Real Madrid earned 93 points instead of 100 of Real Madrid. Real Madrid is on the frontier, thus the efficiency index of FC Barcelona is calculated dividing 93 by a figure a bit greater than 100. The result is that the efficiency from the production function was 0.88. The interpretation is that to be fully efficient FC Barcelona would have to gain 106 points. 0.88 is a high efficiency index, the fourth in the ranking, but the league from FC Barcelona was so good?

According to the odds in order to make a season on the average (0.52) FC Barcelona would had to gain 95 points (the red line) but it did 91 points (the green line). Now let us assume that FC Barcelona would have gained 80 points, ceteris paribus. In the production frontier the efficiency would be close to 0.8, so a high efficiency but in the odds methodology the efficiency would be around 0.05, so a very bad season that is a much more sensible efficiency index.
On the other hand, Real Sociedad, Real Zaragoza and Granada were considered quite inefficient in the production function approach (i.e., 12, 14 and 15 respectively in the rank) but they were considered quite efficient in the odds approach (i.e., 5, 7, 6 respectively in the rank). Why do arise these huge differences? The answer is the over-performing of Levante. Levante with a close squad quality to these teams performed a really good season, thus the frontier for these teams is defined by the Levante. Thus, even though they have done a really good season according to the expectations from the odds they were not considered such good in the production function. So, once again the odds methodology seems to be appropriate than the production function in this framework since the efficiency of a team does not depend from a over-performing of other team.
Last but no least the coefficient of correlation between the efficiency from the production function and the squad value was 0.34 whereas the coefficient of correlation between the efficiency from odds and the squad value was 0.02. That is, the production frontier methodology is not able to produce an efficiency index not related with the quality of the teams but the efficiencies using the odds methodology are not related at all with the quality of teams which is an adequate property for the efficiencies.
Thus, the efficiencies of managers/clubs derived from the odds look to be a good alternative to the well-established production function approach.
* I acknowledge the valuable assistance in recording the data from Fernando del Corral, Raúl Laguna and Jesús Gómez-Roso.
[1] In doing so the odds are converted into probabilities and subsequently it is used the formula that tells us that the joint probability of two independent events (e.g., a victory of the same team in two different football matches) equals the product of their probabilities. Using this simple formula for all possible combinations of match results of each team, the probability of each team within a league obtaining a certain amount of points can be computed. The total points ranges between zero (i.e., the team loses all matches) and the product of the number of matches and three (i.e., the team wins all matches). In particular, we use the betting odds from CODERE APUESTAS.