ITISE2018

Last week I attended the ITISE2018 conference in Granada, Spain (5th International Conference on Time Series and Forecasting). It is a nice conference, not too big, quite multidisciplinary and in a rather nice setting. Attendants had also the chance to speak to really interesting people working on time series modelling and forecasting from many different perspectives, big data included. Some of the people around were first rank (Peter M Robinson or Andrew C Harvey among others are good examples).

I just gave a short talk (jointly prepared with D Villegas, M Villegas and JR Trapero) on SSpace (see slides here). This is a MATLAB toolbox for State Space modelling and forecasting in a very flexible and efficient way (it will come up soon in the Journal of Statistical Software). It has many advantages on other pieces of software about SS modelling:

  • It is free.
  • It incorporates up-to-date algorithms, models and methods on SS systems. It allows for rather general linear Gaussian models, non-Gaussian models and non-linear models.
  • The models are specified by writing a MATLAB function. In this way, the user has complete flexibility to specify the model.
  • Templates for general and particular models in SS forma are provided with the toolbox.
  • We have tried to make the toolbox as friendly as possible to the user. For example, there is only one function for filtering regardless of the type of model, this means that such function selects internally whether the model is linear-Gaussian, non-Gaussian or non-linear. Then, the user neither have to worry about the type of system is using nor select and remember the correct function name for the appropriate filtering function, reducing the risk of errors. This is just one example of many.
  • This design makes possible a full time series analysis with just a few functions with a code that is rather simple and repetitive, i.e. easy to remember. Even those who are not interested in State Space modelling would find the toolbox compelling. Function names were chosen following nemonic rules, so that the user have to remember just a few names and will be easy to locate those functions forgotten.
  • The toolbox is provided with eight examples with thorough explanations that introduce  the user to all the features of the toolbox.

In summary, a pleasant conference that gave me the opportunity to disseminate a bit the work we have done during the last years.

EURO2018

I have just been to the EURO2018 conference (29th European Conference on Operational Research) in Valencia (Spain). Many comments come to my mind. Firstly, Valencia is an impressive city to live and to make some sightseeing. People is really, really friendly and lively (and lovely). Secondly, once more I have realized that everybody speaks about big data, big data, big data… Finally, though I did not speak about big data, people kindly listened to me, and  I received some support from listeners.

My presentation was entitled (jointly prepared with Marco A Villegas and Diego Villegas) ‘Automatic forecasting support system for business analytics applications based on unobserved components models (slides here) and basically, I tried to do three main things:

  • Publicize the use of Unobserved Components (UC) models for forecasting. In the end they are not so bad in comparison to Exponential Smoothing or ARIMA models, and actually I showed that UC are better in some cases and no worse in others.
  • Develop a general Automatic Forecasting Support System based on UC models. This is the first time that automatic identification of UC has been proposed. The idea is to fit all possible combinations of trend, seasonal and irregular sensible models and select the one with the smallest BIC. I am sure this procedure sounds familiar to many people.
  •  Make a thorough comparison among methods and different implementation of each methods. In particular, two implementations of Exponential Smoothing, three of ARIMA, two naive and obviously, the UC. For the database we used the UC was the best.

I do not pretend to say that UC are going to be the best in absolute every situation. The argument is no more than stating that UC models are no worse than other well stablished methods. And they have been around for a while but very little used in forecasting (check any forecasting competition or in general the forecasting literature).

In all this stuff, SSpace plays an essential role. SSpace is a MATLAB toolbox (it will come out soon published in the Journal of Statistical Software) for general and flexible State Space models. Please, feel free to download it from here and try it out.

A second presentation in which I participated (and presented by Juan R. Trapero, check out here) was entitled ‘Implementation of exponential smoothing forecasting method in a GPU for big data problems’. He showed that the use of GPUs is the way to go in forecasting applications when massive databases ought to be forecast. The advantages in computation time are impressive in big data problems. It was interesting to check that many people became interested straight away. We hope this materializes in something else than just interest, but that is another story I will tell you in the near future…

Conferencia en la Universidad Complutense de Madrid

Ayer estuve en la Complutense dando la charla titulada “Inteligencia predictiva a través de modelos de Espacio de los Estados y otras consideraciones” (las diapositivas, un poco crípticas, están aquí). Se trata de una charla en el Master Universitario de Economía que se imparte la Facultad de Ciencias Económicas y Empresariales. Pretendía extender un poquito lo que los alumnos habían visto en la docencia reglada del master con los modelos de Espacio de los Estados, con la intención de abrir horizontes a la gente joven que se está iniciando en el mundo de la investigación y laboral. Además se mostró muy brevemente cómo funciona la toolbox de Matlab conocida como SSpace, muy interesante para todo aquel que tenga que lidiar con el análisis de series temporales (descargable aquí)

La segunda parte versó sobre una colección de pensamientos desordenados sobre la que se nos viene encima con los temas de Big Data, Deep Learning, etc. y cómo puede cambiar (está cambiando) el panorama de la investigación en Economía.

Fue una ocasión muy interesante para ver a conocidos y compartir muchos comentarios durante y después del evento. Especiales gracias a Alfredo García Hiernaux por asistir y sobre todo a Antonio Jesús Sánchez Fuentes por la invitación.

Curso de Inteligencia Predictiva

El Lunes y Martes 27 y 28/11/2017 estaré en Sevilla impartiendo el curso “Introducción a la Inteligencia Predictiva en R con aplicaciones”, dentro del Programa de Doctorado en Ciencias Económicas, Empresariales y Sociales, Departamento de Análisis Económico y Economía Política de la Universidad de Sevilla.

El objetivo principal del curso es demostrar la utilidad y potencia de R en el análisis de datos, tanto en problemas de sección cruzada, como en series temporales y predicción. De forma progresiva en cuanto a complejidad, se irán analizando un conjunto de técnicas de inteligencia predictiva, como son la regresión, regresión logística, modelos de alisado exponencial y ARIMA. El curso es de carácter eminentemente práctico, con muchos ejemplos y casos para analizar. Se divide en seis sesiones de dos horas en las que se hará una introducción teórica para cada técnica, para luego resolver los casos propuestos en R. El curso es de carácter introductorio, pero los alumnos que lo completen tendrán un buen nivel de partida para extender o adaptar por ellos mismos lo aprendido a sus propios temas de investigación. Se anima a los asistentes a que sometan sus propios casos de análisis.

El material del curso se puede descargar aquí.

CIO 2017

A new contribution to the 11th Interational Conference on Industriale Engineering and Industrial Management (5th-6th July), entitled “Demand Forecasting model selection. A support vector machine approach” was presented by M.A. Villegas and co-authored by J.R. Trapero and myself. It presented an attempt to improve identification of forecasting models by the aid of Support Vector Machine techniques.

Please, ask the authors (marcos.villegas@uclm.es, diego.pedregal@uclm.es and JuanRamon.Trapero@uclm.es) about availability and any question you would like address on this respect.

Abstract: Forecasting inventories is a research area with a wide margin of improvement. The amount of information that has to be processed in real life makes compulsory the use of automatic identification of the appropriate data techniques. This paper proposes a new model selection approach that combines different criteria along with additional information of the alternative models and the time series itself using a Support Vector Machine (SVM). Given a set of candidate models, instead of considering any individual criteria, a SVM is trained at each forecasting origin to select the best model. The effects of the proposed approach are explored empirically using a set of representative forecasting methods and a dataset of 229 weekly demand series from a leading household and personal care UK manufacturer. Findings suggest that the proposed approach results in more robust predictions with lower mean forecasting error and biases than base forecasts.

Researh stay in Rome

I spent July in Rome working with Prof. Tommaso Proietti on State Space methods and Unobserved Components Models. It has been quite a nice time there in many respects. Mainly because it was a very friendly and informal envirnoment to which it is easy to adapt, but also because we had many chances to speak about many things I was wondering about and getting a much deeper insight in many other points, thanks to Tommaso’s sharp points of view. There will be much work coming up in the next months related to this marvelous experience. Ah! I went with my family, what added a completely different view of this refreshing experince (though the weather was rather hot indeed!!).

Economía para ingenieros

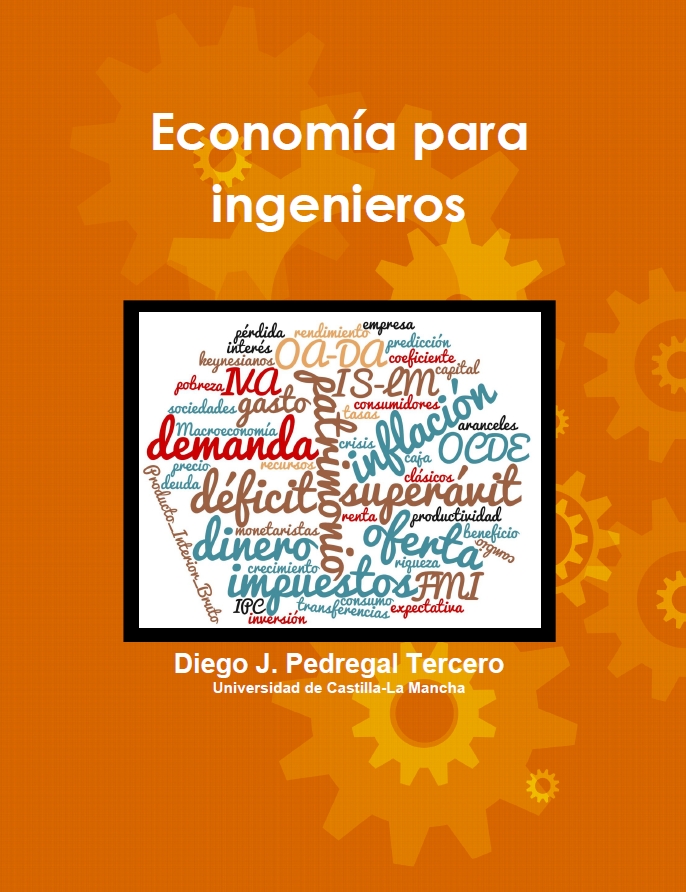
portadaNuevo libro sobre Macroeconomía.

Hoy día la Economía, para bien o para mal, está presente en las vidas de todo el mundo, incluyendo a empresas, gobiernos y todo tipo de instituciones. Están de moda los “economistas estrella” y las tertulias de corte económico. A menudo se echa en falta rigor en los argumentos, debido a que no se dispone de un planteamiento completo y riguroso, que en el caso de la Economía se estructura a través de modelos. La falta de visión de conjunto lleva a afirmaciones que son incompatibles entre sí, llegando en algunos casos a hacer afirmaciones tan burdas que cualquiera se da cuenta de las falacias.

Aparte de esta motivación más general hay que tener en cuenta que la adaptación al Espacio Europeo de Educación Superior de la universidad española ha supuesto en los planes de estudio de ingenierías una reducción de contenidos considerable, especialmente en algunas materias. Esto es particularmente cierto en las asignaturas relacionadas con la Economía. En los nuevos grados que mejor tratan esta disciplina, la asignatura de Economía (que hace años era anual), se ha relegado a algún tema dentro de otras asignaturas más relacionadas con la gestión y dirección de empresas. En todo caso, los ingenieros de hoy día que se forman en España, reciben solo alguna noción de Microeconomía.

El caso de la Macroeconomía es aún más difícil, que simplemente tiende a desaparecer por completo, salvo en casos en los que haya un especialísimo interés en mantenerlo, que algún caso hay. A estos profesores o ingenieros que quieren tener unas nociones de Macroeconomía en un tiempo récord va dirigido este libro. En él se pretende proporcionar una visión sistemática de un modelo completo macroeconómico que se puede impartir en ¡medio cuatrimestre!

Naturalmente, lo único que se pretende es proporcionar un andamiaje básico sobre el que se puede fundar un estudio más serio y más profundo posterior. Pero, al menos, los estudiantes pueden tener una visión completa y estructurada de la forma de pensar de los economistas a través de un modelo de Síntesis Neoclásica.

El libro es en gran medida una actualización de “Manual de Macroeconomía. Todo lo necesario para entenderla”, de esta misma editorial. Es a la vez una simplificación para que el lector pueda asimilar el modelo en tiempo récord. Por ello, se han corregido algunas erratas, se han eliminado algunas partes más prosaicas, a la vez que se ha completado el modelo, se han actualizado la información empírica hasta los datos más recientes y se han incluido muchos ejercicios con soluciones. Si el usuario lo desea puede seguir utilizando el libro Excel llamado Macroeconomía para tener una idea de cómo funciona el modelo completo (este libro está disponible en http://www.uclm.es/profesorado/diego).


ISF2016

I have just arrived from the ISF2016 (International Symposium on Forecasting 2016), that was celebrated at Santander, at the Magadalena Palace. Everybody who has been to this place would agree that it is an outstanding place, in a marvelous location. We had the opportunity to meet some of the world’s leading forecasters, econometricians, time series analysers, …

The organization was superb and did everything in their hands to make the stay as confortable as possible to all the delegates. As a matter of fact, there was also some nice and incredible surprises celebrated by everybody that should be kept secretly. All the attendents would know what I am referring to.

We took advantage to present SSpace, a new toolbox for State Space analysis written in MATLAB. Below you have the abstract of the presentation, and here you have the slides presented. Full documentation may be found at solid-analytics.org, and much more information will come up little by little. Actually, we are improving it by writing all the code in C++ and this will allow us to plug it into many other alternative platforms, at the same time that we will improve speed considerably. Hopefully, a fully operative R version and a journal paper will appear soon.

Please, ask the authors (diego.pedregal@uclm.es and marcos.villegas@uclm.es) about availability and any question you would like.

Abstract: Flexible time series modelling with SSpace.

SSpace is a library for State Space modelling. State Space is in itself a powerful and flexible framework for dynamic system modelling, and SSpace is conceived in a way that try to enhance such flexibility to its maximum. In this sense, the toolbox incorporates a number of powerful features, some of them standard but some others not so standard. Most of them having to do with the algorithmic power of the library, e.g. exact, diffuse or ad-hoc initialisation of recursive algorithms is possible; univariate treatment of multivariate systems is implemented; different objective functions are included, like (concentrated) Maximum Likelihood, forecast errors several steps ahead, etc. The most salient feature of SSpace is that users implement their models by coding a function. In this way, the user has complete flexibility when specifying the systems, having absolute control on parameterisations, constraints among parameters, etc. Besides, the library allows for some ways to implement models in a rather non-standard fashion, like using arbitrary non-linear relations with inputs, transfer functions without using the State Space form, etc. The toolbox may be used on the basis of scratch State Space systems, but is supplied with a number of templates for standard models. A full help system and documentation is provided individually for each function and also in html format. The way the toolbox is conceived allows for extension in many ways, surely some of them the authors have not imagined. In order to fuel such extensions and discussions a forum has been launched. SSpace is being exploited successfully currently in different applications, like transport logistics, traffic casualties, energy forecasting, supply chain forecasting, etc.

Conference in Seville

The XIX Conference on Applied Economics took place at Seville, between 9th and 10th of June. It was a very nice place, very nice people, with a superb program both in English and Spanish. Click here to check the particular information about the conference.

One of the paper presented by the group AEM (Applied Economics & Management Research Group), actually the one I presented was entitled: Measuring the effects of LCCs on traditional and charter airlines: a case study of the Spanish airport system. Below is the abstract and here are the slides. Hopefully a full paper in an international journal will soon come up with all this material.

Abstract: The advent of the low-cost carriers (LCCs) in the middle of the 1990s brought an end to the European airline market being shared between network carriers (NCs) and charter carriers (CCs). Using a robust methodology based on transfer function models, the present paper seeks to offer empirical evidence as to the size and typology of the effects that LCCs have had on traffic for NCs and, in a wholly original way, CCs, using the Spanish airport system as a case study. Our results show a clear substitution relationship between both CCs and NCs and LCCs in their typical niche markets, national and European flights. New demand generated in the domestic air market only amounts to 30% of LCC traffic, while the percentage exceeds 80% in the case of the European market. NCs can be seen to have reacted positively with respect to flights outside Europe. The complete lack of sensitivity of CC traffic to terrorist attacks, the day of the week, air accidents and the economic crisis is also evident. CCs present differentiated behavior that clearly shows that they should be considered an independent category that justifies individualized analyses, such as the present study.

“Previsiones” fiscales finales para 2015


En este post FISCAL, publicado en colaboración con Antonio Jesús Sánchez Fuentes (de la Universidad Complutense de Madrid), realizamos un ejercicio de nowcasting de las previsiones fiscales para el año 2015, dada la proximidad de la publicación de los datos definitivos y la publicación de previsiones de organismos públicos y privados de relevancia.

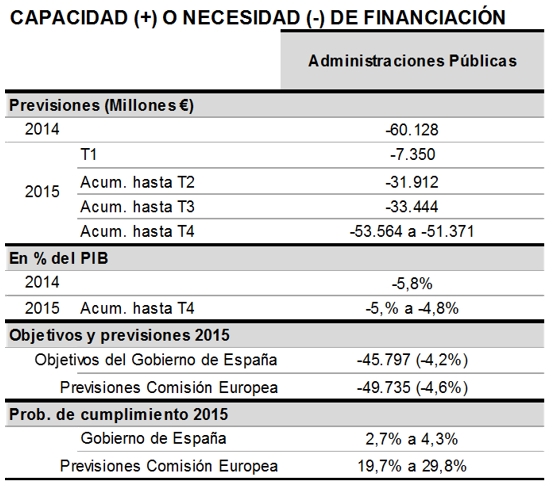
Nuestra visión, con la información actualizada hasta noviembre del año pasado, se resume en las tablas 1 y 2. Desde nuestra última actualización la situación ha empeorado sustancialmente, puesto que esperamos que el déficit para el conjunto de las Administraciones Públicas oscile entre 51.300 y 53.500 millones de Euros. La probabilidad de que se cumpla el objetivo del Gobierno de España es prácticamente nula (4,3% en el modelo más optimista). La situación es algo más optimista para el caso de las previsiones de la Comisión Europea (que eran bastante más conservadoras que el objetivo del Gobierno), pero en cualquier caso es pesimista (la probabilidad no llega al 30%).

Tabla 1. Previsiones de déficit de las AAPP españolas para el año 2015

tabla1

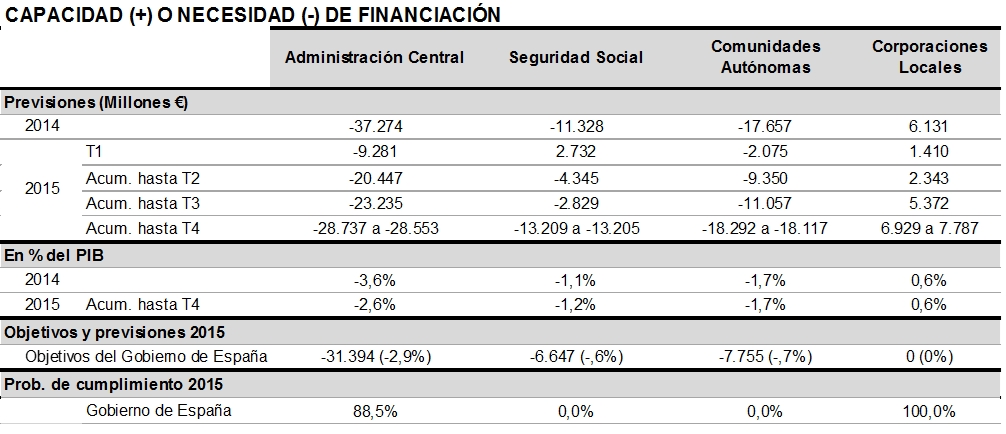
La visión desagregada de la Tabla 2 muestra que las desviaciones, como ya habíamos visto en el post de noviembre pasado, se deben a la Seguridad Social y las Comunidades Autónomas. La Administración Central cumple sobradamente con los objetivos, y las Corporaciones Locales experimentan un superávit que sirve de paliativo de los problemas en los demás sectores. La diferencia fundamental con nuestras previsiones anteriores es que el saldo ha empeorado en el caso de las Comunidades Autónomas, a la vez que ha mejorado algo la situación de la Seguridad Social. En estos dos últimos casos las probabilidades de cumplimiento de los objetivos del Gobierno son nulas.

Tabla 2. Previsiones de déficit por sectores institucionales

tabla2

La Figura 1 ilustra cómo se ha deteriorado la situación desde que realizamos las últimas previsiones, puesto que en Noviembre pensábamos que las desviaciones del objetivo total serían 3.400 millones de €, mientras que las previsiones actuales de la desviación se han más que duplicado, hasta 7.200 millones.

Figura 1. Previsiones del saldo de las administraciones públicas españolas para 2015, con distintos orígenes de predicción. Las líneas rojas gruesas muestran los objetivos, los puntos negros son observaciones reales, las líneas blancas previsiones de distintos  modelos, las bandas grises muestran del rango de predicciones de los distintos modelos.

fig1

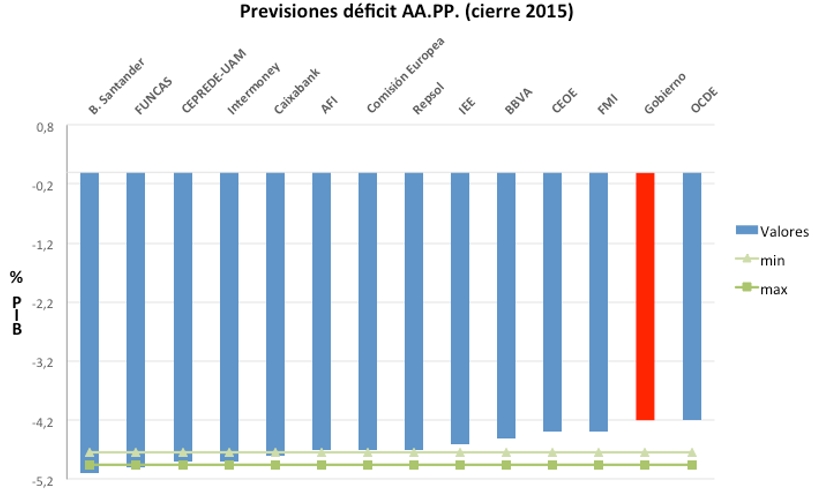
Figura 2: Comparativa de previsiones de déficit público, de cara al cierre de 2015

fig2

Fuente: Elaboración propia, a partir de nuestras propias estimaciones y los datos publicados por El Mundo (18/01/2016)

Para concluir, conviene situar los números presentados hasta ahora en perspectiva, mirando a las previsiones publicadas por otros organismos. Así, comparamos nuestras previsiones con las publicadas a mediados del pasado mes de enero en el periódico El Mundo (aquí). Para ello, incluimos la Figura 2 con la previsión oficial del gobierno (barra roja), las previsiones de los distintos organismos (barras azules) y el rango de valores obtenidos con nuestros modelos (líneas verdes). Como se puede ver, coincidimos con la mayoría de analistas en cuanto al posible incumplimiento de la previsión oficial del gobierno. Además, nuestros modelos, sin llegar a valores fuera del “consenso” reflejado en este gráfico, se sitúan más en línea con aquellos que vaticinan una mayor diferencia respecto a ésta. En concreto, nuestro rango de predicciones se muestra compatible con las proporcionadas por FUNCAS, CEPREDE-UAM, Intermoney, AFI y la propia Comisión Europea.